SQL completes the task by nesting three layers and using window functions;
Have you got it?
The Professional Data Processing Language
There are three main types of programming languages for processing structured data at present:
| SQL is based on relational algebra theory 50 years ago | SPL is based on creative discrete dataset theory |
|---|---|
| Lack of discreteness and incomplete set-orientation | Full combination of discreteness and set-orientation |
| Barely support ordered calculation | Supper ordered calculation |
| Do not advocate step-by-step calculation | Advocate step-by-step calculation |
| ➥The code for complex operations is lengthy and difficult to write | ➥Good at complex operations |
| Difficult to implement high-performance algorithms | High performance basic algorithms and storage mechanisms |
| ➥Unable to take full advantage of hardware capabilities | ➥Take full advantage of hardware capabilities |
| Closed, only the data in the database can be calculated | Open, can calculate any data source |
 |
 |
SQL has certain computing power, but it is not available in many scenarios, so you will have to hard code in Java. SPL provides lightweight computing power independent of database and can process data in any scenario:
You can calculate files through SPL native syntax, and support SQL file query, which is simple and convenient.

SPL can enhance mongoDB's computing power and simplify the computing process.

SPL provides the computing power independent of the database to complete the post calculation of various data sources.

SQL is difficult to deal with complex sets and ordered operations, and it is often read out and calculated in Java. SPL has complete set capability, especially supports ordered and step-by-step calculation, which can simplify these operations:
select max(continuousDays)-1
from (select count(*) continuousDays
	from (select sum(changeSign) over(order by tradeDate) unRiseDays
		from (select tradeDate,
			case when closePrice>lag(closePrice) over(order by tradeDate)
			then 0 else 1 end changeSign
		from stock) )
	group by unRiseDays)
SQL completes the task by nesting three layers and using window functions;
Have you got it?
| A | |
| 1 | =stock.sort(tradeDate) |
| 2 | =0 |
| 3 | =A1.max(A2=if(closePrice>closePrice[-1],A2+1,0)) |
In fact, this calculation is very simple. According to natural thinking: first sort by trading date (line 1), then compare the closing price of the day with the previous day, if higher, +1, otherwise clear it, and finally find a maximum value (line 3).
WITH TT AS
	(SELECT RANK() OVER(PARTITION BY uid ORDER BY logtime DESC) rk, T.*  FROM t_loginT)
SELECT uid,(SELECT TT.logtime FROM TT where TT.uid=TTT.uid and TT.rk=1)
		-(SELET TT.logtim FROM TT WHERE TT.uid=TTT.uid and TT.rk=2) interval
FROM t_loginTTTT GROUP BY uid
The return value of an aggregate function is not necessarily a single value, but can also be a set.
With complete set-orientation, it is easy to implement aggregation for grouped subsets that returns a set.
| A | ||
| 1 | =t_login.groups(uid;top(2,-logtime)) | The last two login records |
| 2 | =A1.new(uid,#2(1).logtime-#2(2).logtime:interval) | Calculate interval |
WITH B AS
	(SELECT LAG(amount) OVER (ORDER BY 月份) f1, LEAD(amount) OVER (ORDER BY smonth) f2,   A.* FROM orders A)
SELECT smonth,amount,
	(NVL(f1,0)+NVL(f2,0)+amount)/(DECODE(f1,NULLl,0,1)+DECODE(f2,NULL,0,1)+1) moving_average
FROM B
The window function has only a simple cross-row reference, if a set is involved, members need to be used to spell.
An ordered set can provide cross-row set reference.
| A | |
| 1 | =orders.sort(smonth).derive(amount[-1,1].avg()):moving_average) |
SELECT max(consecutive_days)-1 FROM
	(SELECT count(*) consecutive_days FROM
		(SELECT SUM(updown_flag) OVER ( ORDER BY trade_date) nonrising_days FROM
		( SELECT trade_date,
			CASE WHEN  close_price>LAG(close_price) OVER( ORDER BY trade_date THEN 0 ELSE 1 END updown_flag
		FROM stock ))
	GROUP BY nonrising_days )
Another order-related grouping, which generates a new group when the condition is true.
| A | |
| 1 | =stock.sort(trade_date).group@i(close_price<close_price [-1]).max(~.len()) |
The computing power of the database is closed and cannot process data outside the database. It is often necessary to perform ETL to import data into the same database before processing. SPL provides open and simple computing power, which can directly read multiple databases, realize mixed data calculation, and assist the database to do better calculation.
SPL assists RDB calculation and improves RDB capability.


Multi database cluster computing is realized with the cross database and parallel ability of SPL.


Traditional ETL often starts with L and then ET, which is time-consuming and laborious; The real ETL process can be realized through SPL.

The data processing of microservices often depends on Java hard coding, and it is difficult to implement complex computing. The combination of SPL and microservice framework to implement data processing is more concise and efficient than other development languages.

SQL is difficult to implement high-performance algorithms. The performance of big data operations can only rely on the optimization engine of the database, but it is often unreliable in complex situations.
SPL provides a large number of basic high-performance algorithms (many of which are pioneered in the industry) and efficient storage formats. Under the same hardware environment, it can obtain much better computing performance than the database, and can comprehensively replace the big data platform and data warehouse.
No gun can be made without gunpowder.
SQL is difficult to achieve high-performance structured data computing.
It is futile to only think of a good algorithm but unable to implement it.
Many algorithms here are original inventions of SPL!
| A | ||
| 1 | =file("data.ctx").create().cursor() | |
| 2 | =A1.groups(;top(10,amount)) | Top 10 orders |
| 3 | =A1.groups(area;top(10,amount)) | Top 10 orders of each area |
High complexity sorting is transformed into low complexity aggregation.
| A | ||
| 1 | =file("order.ctx").create().cursor() | Traversal preparation |
| 2 | =channel(A1).groups(product;count(1):N) | Configure traversal reuse |
| 3 | =A1.groups(area;sum(amount):amount) | Traversing,and get grouping result |
| 4 | =A2.result() | Get result of traversal reuse |
Multiple result sets can be returned in one traversal.


Hardware configuration:Intel3014 1.7G/12 core/64G memory , ARM/16 core/32G memory

Mobile banking/ online banking, hundreds of thousands/ millions of concurrent details query
The association between details and organization dimension tables cannot be realized, so wide table redundancy is required
For dimension table data adjustment, the wide table data should be fully updated

Hundreds of millions of customers have many to many relationships with thousands of customer groups, with dozens of dimensions
Thousands of customer groups, too many permutations and combinations
The database calculates the intersection in real time and filters the dimensions, and cannot respond in seconds.
Three ways of analyzing and processing Excel:
More than 80% of the data processing and calculation requirements cannot be completed with visual tools.
The combination of SPL and Excel can enhance the calculation ability of Excel and reduce the difficulty of calculation implementation.

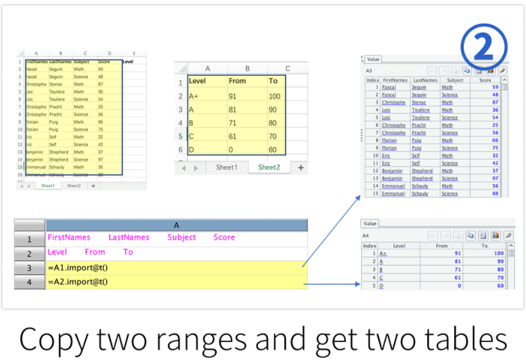
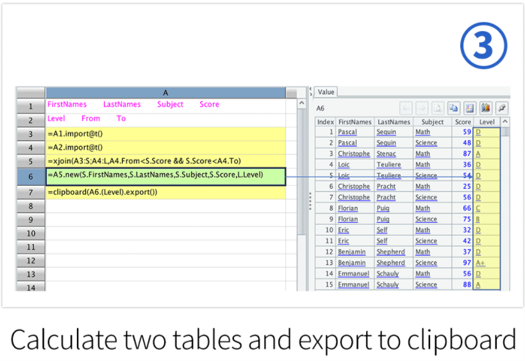

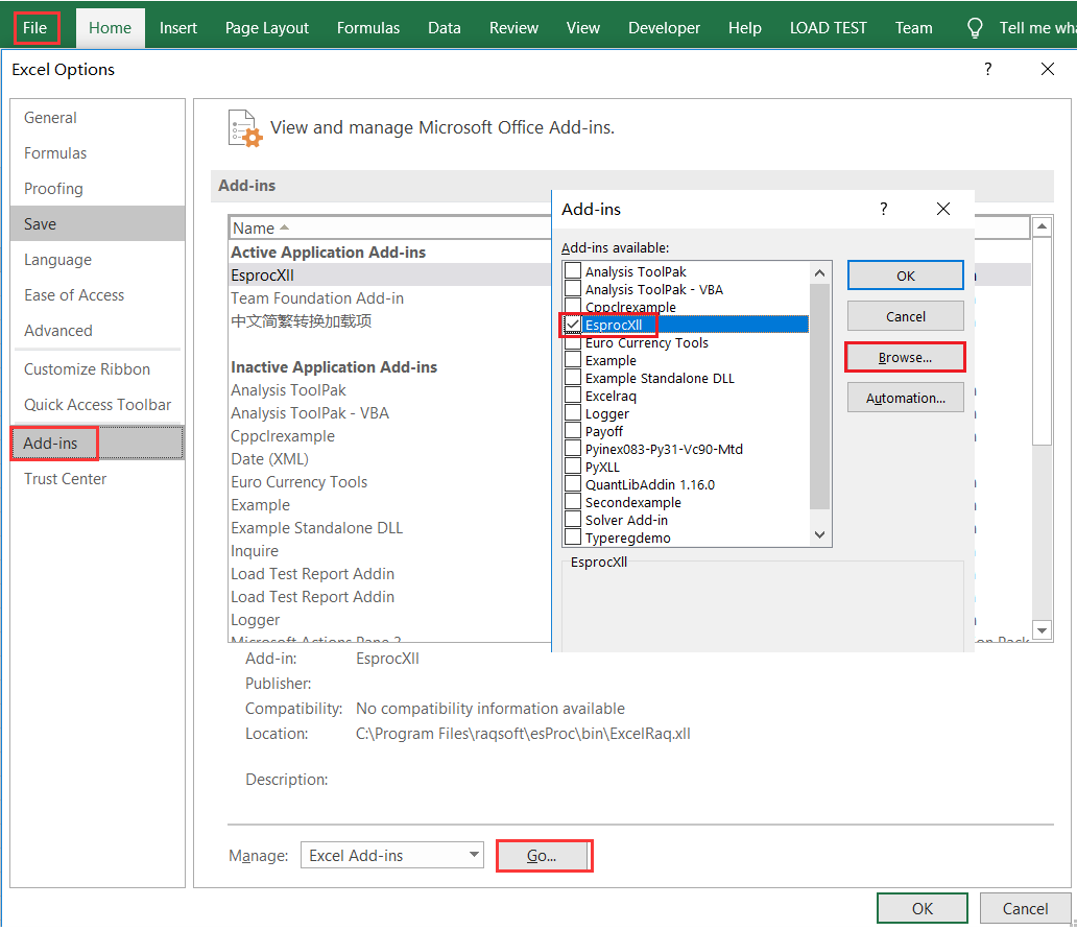
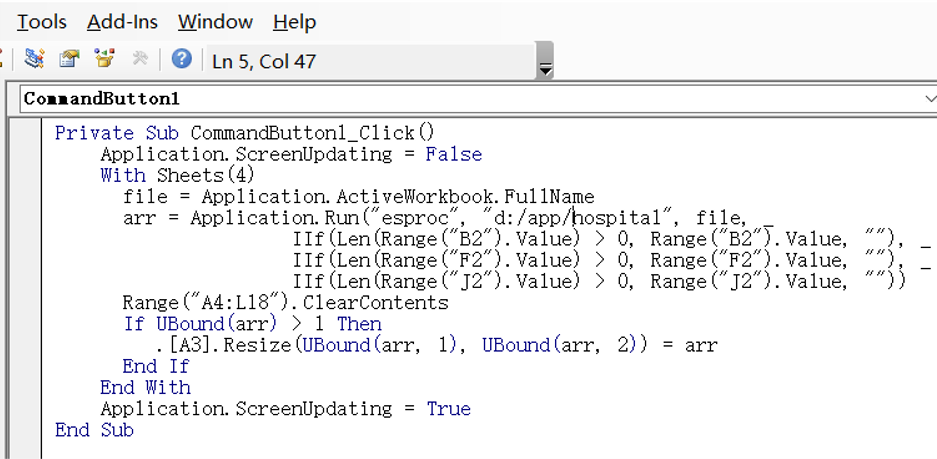
Through SPL's Excel plug-in, you can use SPL functions in Excel to calculate, and you can also call SPL scripts in VBA.

There are a large number of time series data in industrial scenarios, and databases often only provide SQL. The ordered calculation capability of SQL is very weak, resulting in that it can only be used for data retrieval and cannot assist in calculation.
Many basic mathematical operations are often involved in industrial scenarios. SQL lacks these functions and the data can only be read out to process.
SPL can well support ordered calculation, and provides rich mathematical functions, such as matrix and fitting, and can more conveniently meet the calculation requirements of industrial scenes.
Industrial algorithms often need repeated experiments. SPL development efficiency is very high, and you can try
more within the same time period:
Background: a refinery hopes to learn relatively accurate product yield from historical data and use it to formulate raw material processing and product output plans for the next day or in the future.
Objective: a set of coefficients (called yield) is fitted by using the historical production data in the way of linear fitting under constraints, so as to minimize the error between the calculated product yield and the actual yield.

The trend of time series reflects the actual production situation to a certain extent, which is called working condition. If the curve trend is stable, it indicates normal, and rapid rise or rapid decline indicates that abnormal conditions may occur. Corresponding the curve trend to the working condition is helpful to analyze the problems existing in production activities and improve production efficiency.
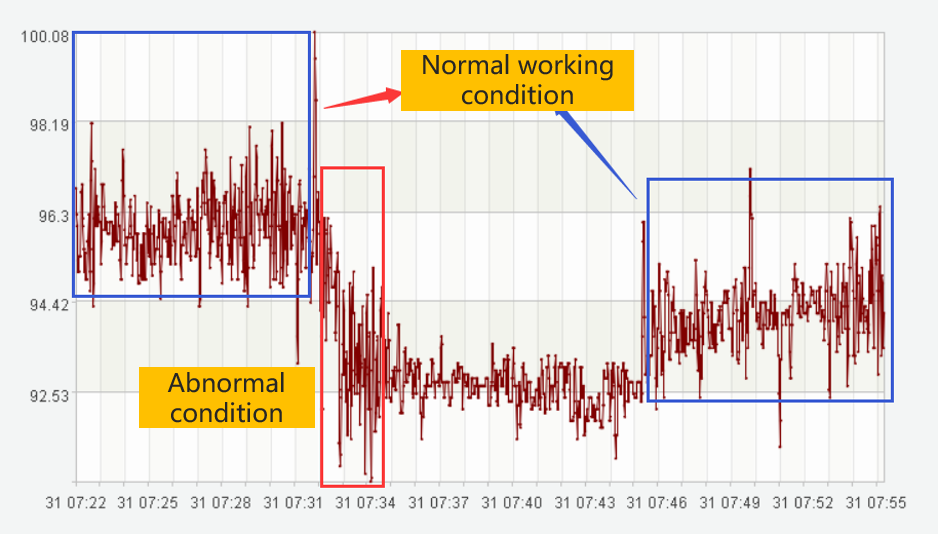
There are usually dozens of units in the refinery, and the number of instruments in each unit is hundreds or thousands. It is impossible to find abnormalities by manual observation, and corresponding algorithms are needed to identify them.

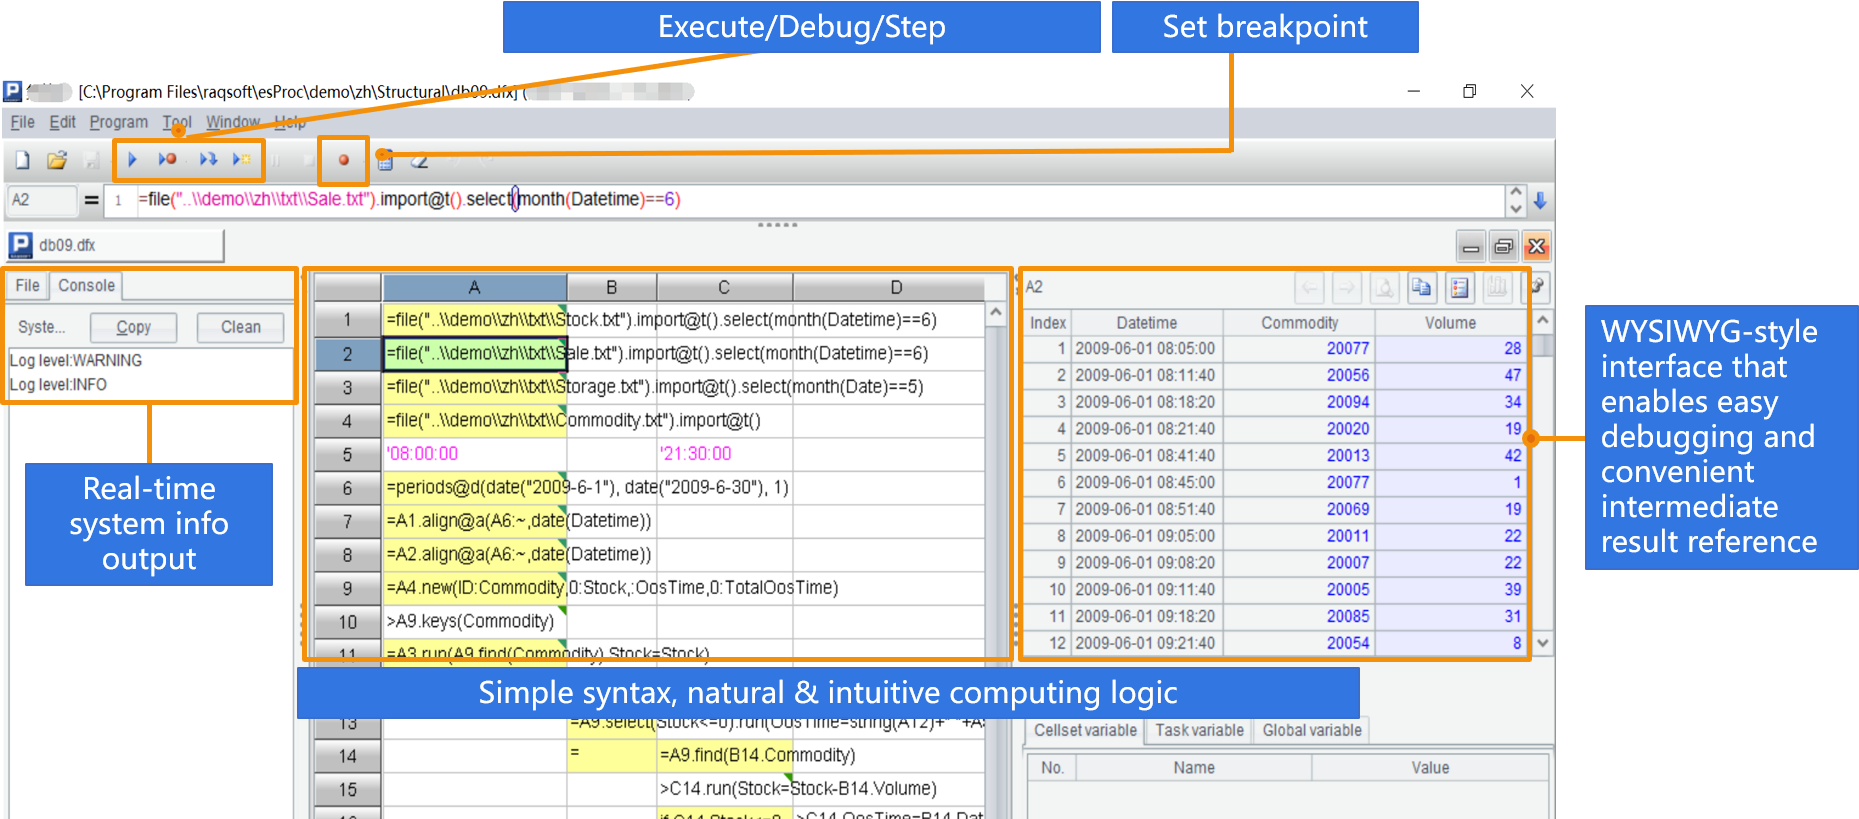
SPL is especially suitable for complex process operations.
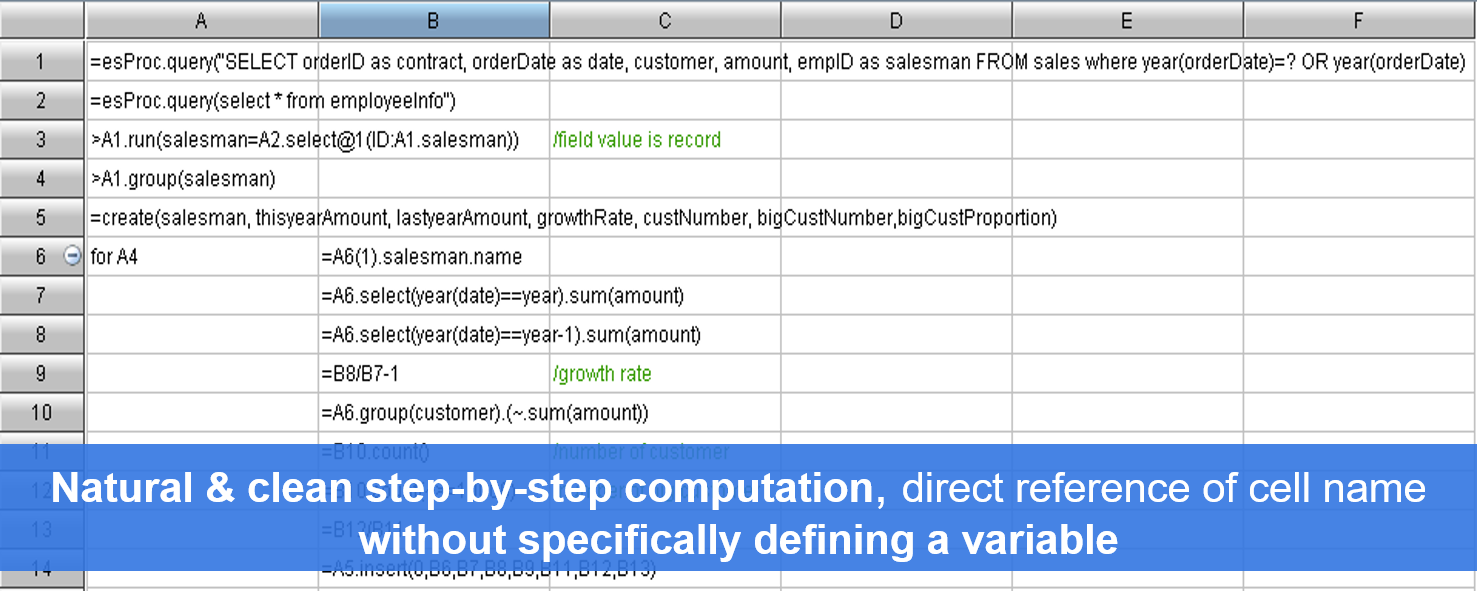
Intended for structured data processing
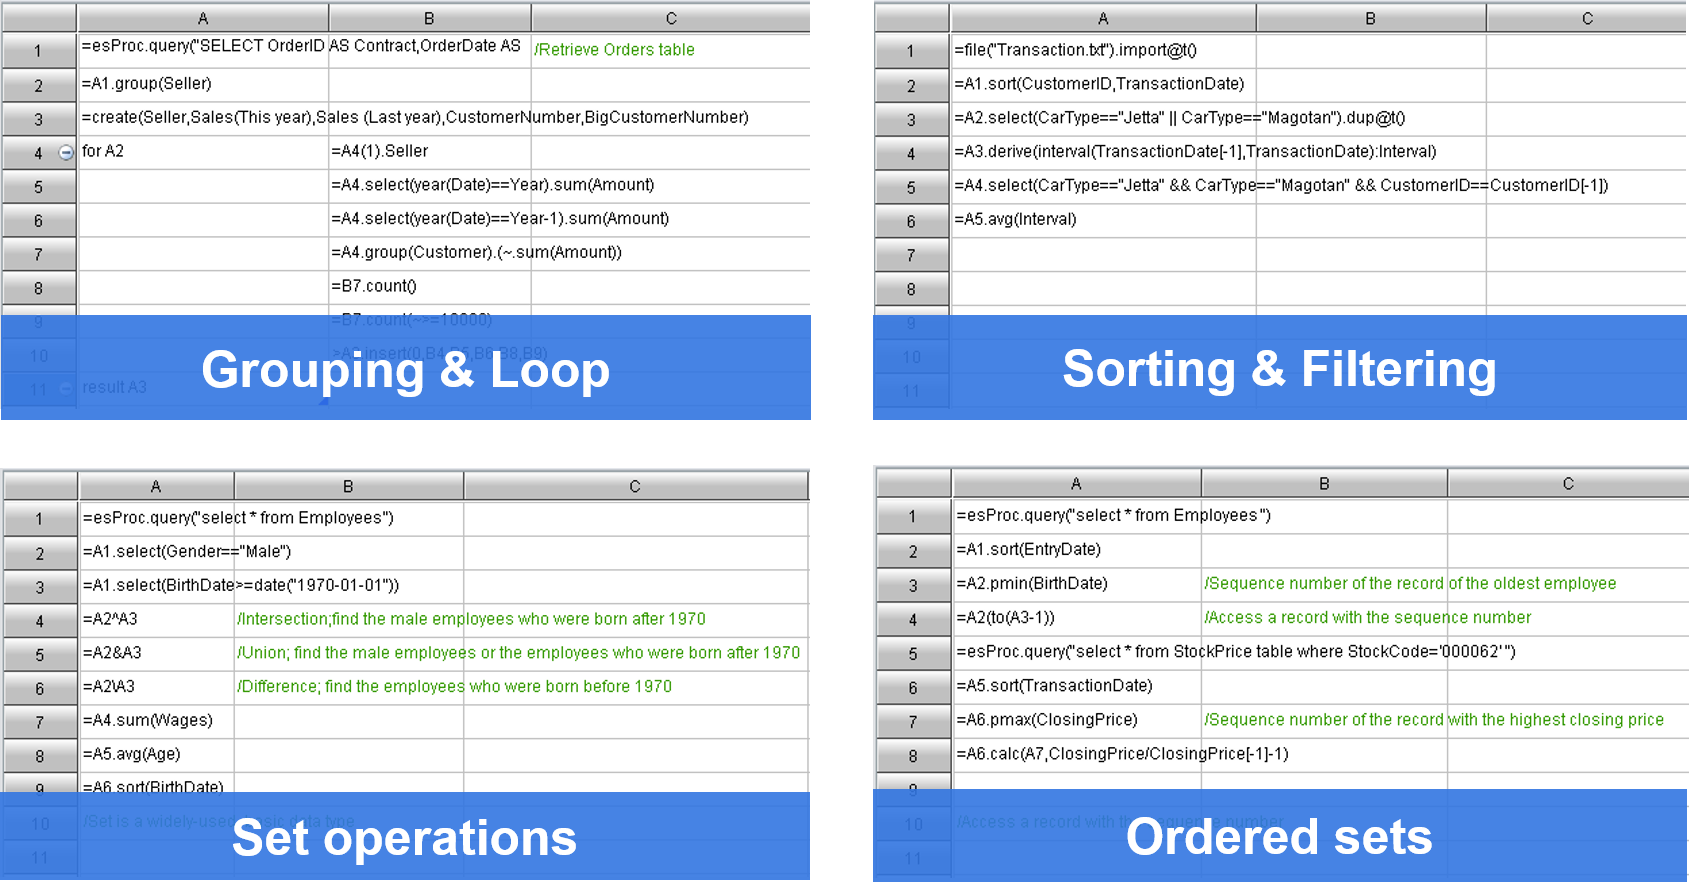
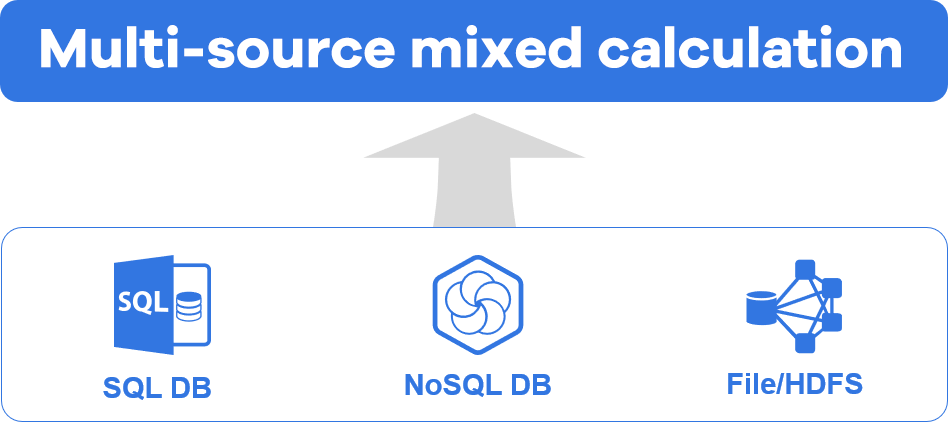
Multiple data sources are directly used for mixed calculation, and there is no need to unify the data (ETL) before calculation.
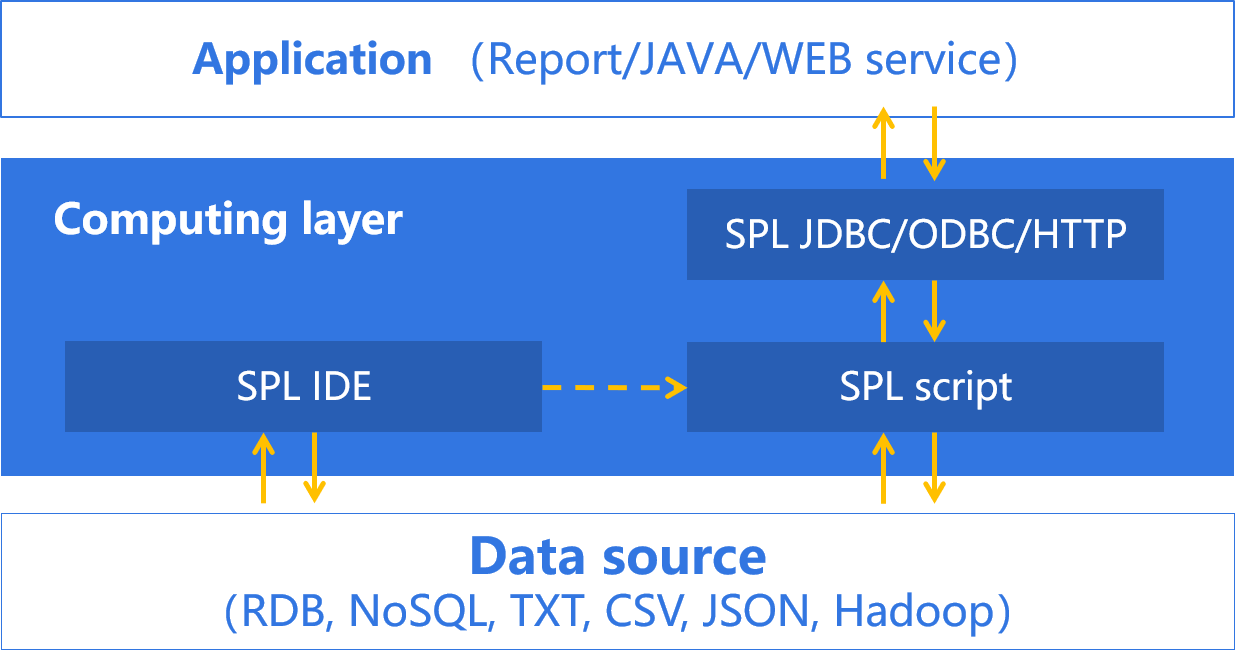
SPL is developed in Java and provides a standard application interface, and can be seamlessly integrated into applications.
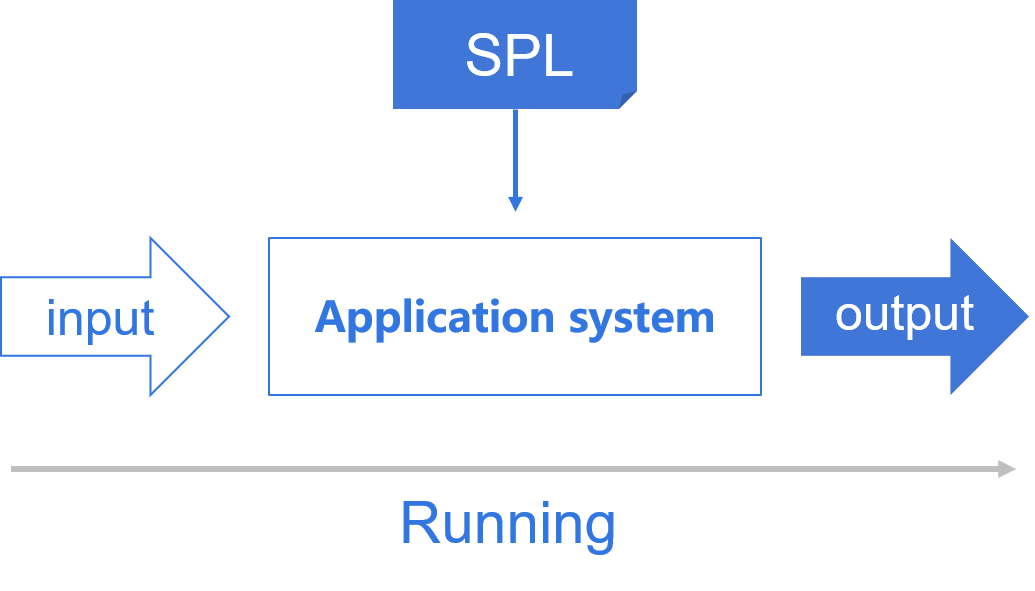
SPL interpreted execution supports hot switching.
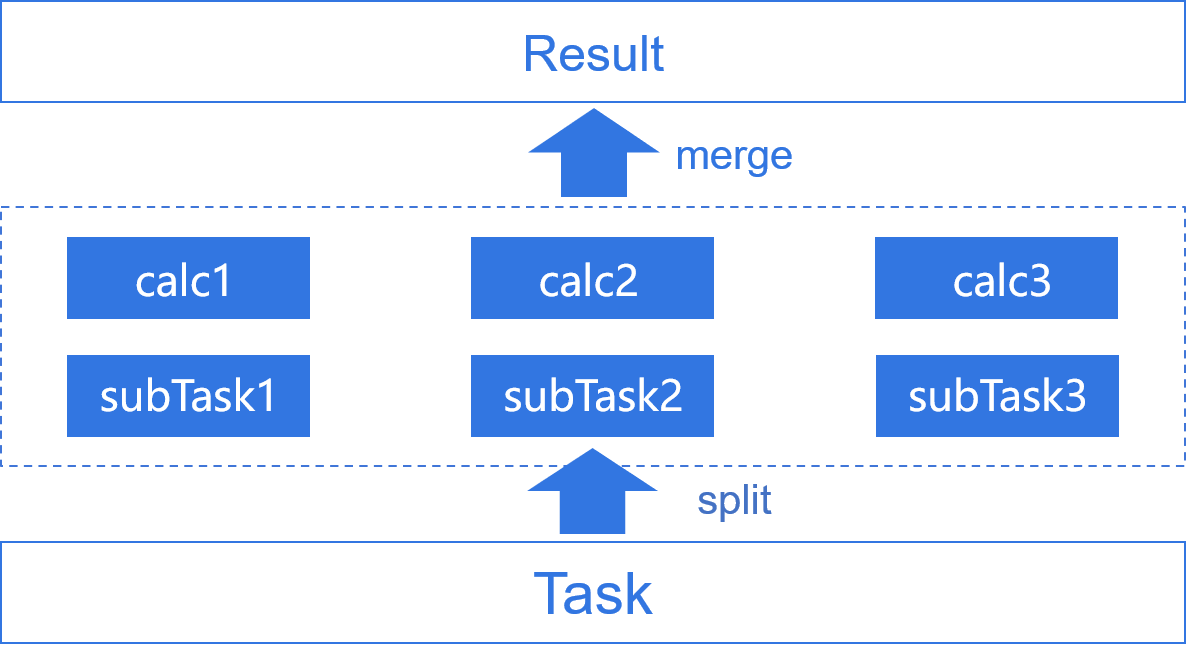
Easily implement multithreaded computing for a single task.
Private data storage format : Bin file, composite table
Support the storage of data by business classification in the form of tree directory
Provide two data fault-tolerant mechanisms: external storage redundancy fault-tolerance and memory spare-tire fault-tolerance

Support computing fault tolerance. When a node fails, it automatically migrates the computing tasks of the node to other nodes to continue to complete.
Users can flexibly customize data distribution and redundancy scheme according to the characteristics of data and computing task, so as to effectively reduce the amount of data transmission between nodes and obtain higher performance.
The cluster does not have a permanent central master node. Programmers use code to control the nodes involved in computing.
Whether to allocate tasks is determined according to the idle degree (number of threads) of each node to achieve an effective balance between burden and resources.